Association measures are mathematical formulae that interpret cooccurrence frequency data. For each pair of words extracted from a corpus, they compute an association score, a single real value g that indicates the amount of (statistical) association between the two words. Some measures distinguish between positive (g > 0) and negative (g < 0) association. Many association measures are based on statistical hypothesis tests, while some others are purely heuristic combinations of the observed joint and marginal frequencies. In general, the association scores computed by different measures cannot be compared directly. They are typically used to rank pair types (as candidates for collocations). Further processing and comparison of measures is then based on n-best lists, regardless of the precise association scores of the candidates. A more detailed explanation of this approach to collocation extraction can be found in Evert & Krenn (2001) and Evert & Krenn (2003).
These pages provide a repository of the numerous association measures that have been suggested and used over the past decades. For each measure, an explicit equation is given in terms of observed and expected frequencies (see below), which can easily be translated into a computer program (while the equations in the original publications are often cryptic or incomplete). In addition, the text provides some background information and references (when available).
Section 1 introduces cooccurrence frequency data, some notation, and a statistical random sample model on which many association measures are based. The individual measures are grouped according to their theoretical motivation and are presented in Sections 2 through 8. This page provides a table of contents with direct links to the sections. A list of association measures is given for each section, so it is easy to locate information about a specific measure.
Implementations of all association measures in this repository are available in the UCS toolkit, which can be downloaded from the software page.
Cooccurrence frequency data for a word pair (u,v) are often organised in a contingency table, which results from a cross-classification of the pair tokens (= instances of cooccurrences) extracted from a corpus. Tokens whose first component belongs to type u are assigned to the first row of the table, and tokens whose second component belongs to type v are assigned to the first column. The cell counts of this contingency table are called the observed frequencies O11, ..., O22 (see the right panel below).
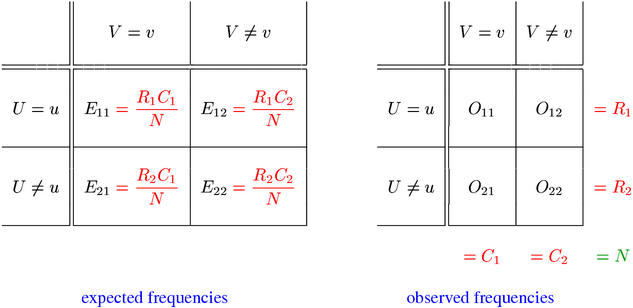
The sum of all four observed frequencies (called the sample size N) is equal to the total number of pair tokens extracted from the corpus. R1 and R2 are the row totals of the observed contingency table, while C1 and C2 are the corresponding column totals. The row and column totals are also called marginal frequencies, being written in the margins of the table, and O11 is called the joint frequency. Equations for all association measures are given in terms of the observed frequencies, marginal frequencies, and the expected frequencies E11, ..., E22 (under the null hypothesis that u and v are statistically independent). The expected frequencies can easily be computed from the row and column totals as shown in the left panel above.